07-04-2019, 04:02 PM
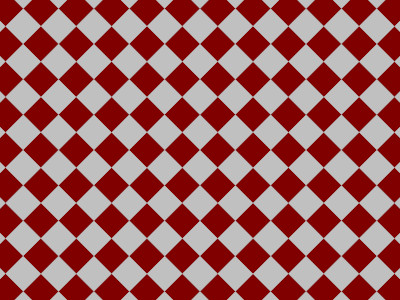
Considere this 400x300 image:

The common way to do this in gimp is :
- create a 800x600 layer (double size compared to image canvas)
- fill it with Filters > Render > Pattern > Checkerboard
- use the unified transform tool to rotate and translate the layer
- crop the layer to the image size
Now with GEGL graph:
- create a 400x300 layer
- run Filters > Generic > GEGL graph and copy paste the text below in the pipeline field
Et voilà!
Note that the indentation is only for better visualisation, it is not needed, all can be writen in one line
Another example:

The common way to do this in gimp is :
- create a 800x600 layer (double size compared to image canvas)
- fill it with Filters > Render > Pattern > Checkerboard
- use the unified transform tool to rotate and translate the layer
- crop the layer to the image size
Now with GEGL graph:
- create a 400x300 layer
- run Filters > Generic > GEGL graph and copy paste the text below in the pipeline field
Code:
checkerboard

  x=25

  y=25

  color1=maroon

  color2=silver


rotate

  degrees=45

  origin-x=200

  origin-y=150
Et voilà!
Note that the indentation is only for better visualisation, it is not needed, all can be writen in one line
Code:
checkerboard x=25 y=25 color1=maroon color2=silver rotate degrees=45 origin-x=200 origin-y=150Another example:
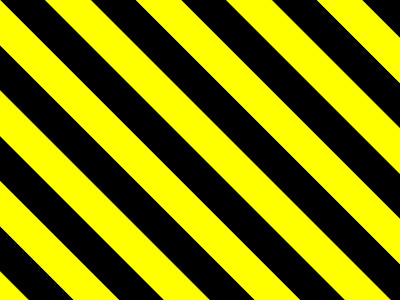
Code:
color value=yellow


over

  aux=[


    grid

      x=64

      line-width=32

      line-height=0

      line-color=black


   rotate

      degrees=45

  ]


