Here is my next plugin to draw parametric curves, the more complicated one. This is an introductory post. I shall soon make another post with more pictures.
To get the plugin, go to
http://kmarkku.arkku.net/
click the link Parametric Curves, scroll down to the bottom and click the Download button. You receive a .zip file which contains three items:
- parametric_curves.py (this is the plugin)
- doc.pdf (the documentation)
- folder example_files (see the site for explanation).
Unzip the .zip file, put the file parametric_curves.py in your Gimp's plug-ins folder, and restart Gimp. The new plugin has name 'Parametric curves' and it will be in Gimp's menu at
Filters / Render / Parametric curves.
This plugin has, just as the simple one, two ways to pass the inputs:
1. By typing everything in the GUI.
2. By writing the inputs in a small Python file (in a specific format!) and then invoking that file in the GUI.
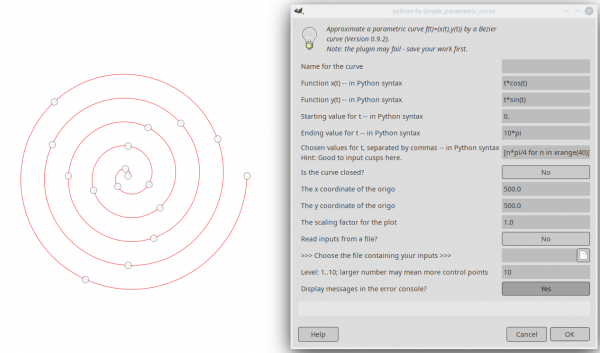
If the inputs are just typed in the GUI, there is not much different from the simple plugin. The big differences come when one feeds the inputs in a file. In this post I talk only about the GUI (about the are alternative in a later post).
The GUI of the new plugin differs from the simple one just in three respects:
1. New option "Fit in the window". Makes the drawing to fill the window. When this is Yes, the inputs for origo and scale are ignored.
2. New option to mark the coordinate axes as guides.
3. The level goes 1..100. (Not very essential and may change in the future.)
But there is one crucial difference between the plugins: the inner workings. The simple plugin often requires some help from the user (custom values for t). This plugin, on the contrary, normally manages without such help. When starting with some parametric curve, it first searches the curve for some special points on the curve and makes an initial subdivision from those, so dividing the curve into smaller arcs. Only then it starts building the approximate Bezier curve, working with each smaller arc separately.
The user need not care about all that. The new plugin just works better than the simple one, normally without requiring any input list of custom parameter values. (But such list can be inputted if needed. For example, if the curve has cusps, the plugin should find them on its own but they will not be quite exact.)
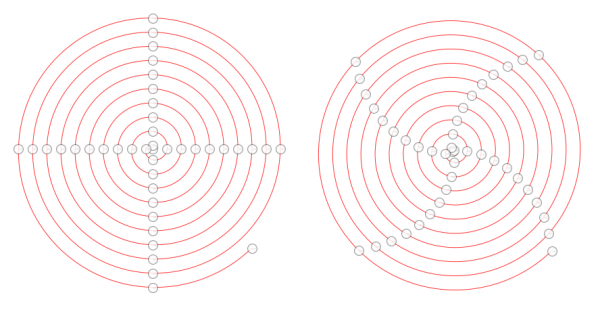
Here is a picture. This is the same spiral as in posts #11 and #15 above except that the arc is drawn up to 20*pi-pi/4.

On the left is the result from the simple plugin with an input list of custom parameter values to create anchors separated by 90 degrees arcs.
On the right is the same spiral with the new plugin, with no custom anchors inputted so that the plugin works on its own.
As you can see, the simple plugin puts anchors exactly where it is told to. The new plugin finds some anchor points by its own inner algorithms, and the result is also very good.
You may ask how the new plugin chooses the initial subdivision. For a general answer, see doc.pdf and there Section 2.4 c2bo. (Or ask here and I will explain.) But for this particular curve the subdivision would consist of 90 degrees arcs, except that since the interval [0, 20*pi-pi/4] cannot be divided in equal parts that way, a little shorter arcs are used. (The value 90 degrees is the default and cannot be changed in the GUI, but it can be changed when inputs are read from a file.)
This was about the GUI. I shall soon make another post with pictures to show what can be achieved when the inputs are passed in a file.
If you have any questions, please ask.


