04-24-2020, 10:28 AM
I updated the plugin to version 0.6. Please take the new version from the same place I mentioned in post #1.
I continue talking of the plugins (see posts #1 and #2). Now the second plugin,
Transform a line figure by a Bezier arc
How to get it and how to invoke it, see the bottom of post #1. This plugin is supposed to be applied only to paths consisting of straight line segments; I call those "line figures". (You can apply it to any paths but only anchors are taken into account, so that the edges between anchors are treated as straight line segments.)
To use the plugin you have to provide four input paths:
1. The Line figure: the path to be transformed (by right-clicking in Gimp's Paths tab).
2. The Base: a path with two anchors.
3. The Target: a path with two anchors.
4. the Shaper: a path with two anchors.
Of the first three input paths only the anchors are taken into account; any curviness is ignored. The Shaper, on the contrary, is supposed to be a proper arching curve: it will determine the "shape" of the transformation, that is, how the transformation will curve line segments.
Just as for the affine maps, the anchors of the Base will be mapped to the anchors of the Target. The position of the Shaper has no effect, only the shape.
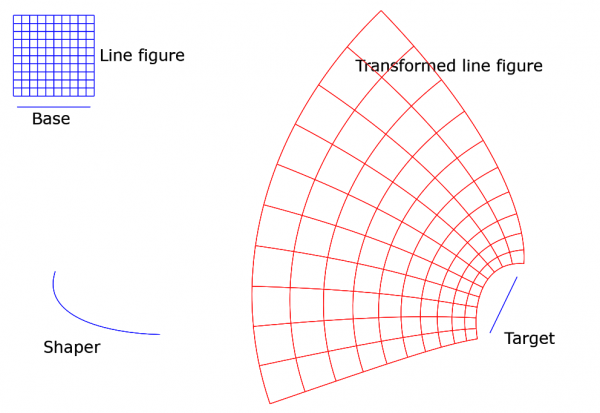
It is easiest to give a picture:

You see the four input paths (in blue). The Line figure is the small grid at top left. The transformation deformes the grid and puts it at a different location; the result is shown in red. Notice that right angles are preserved. This is no coincidence - the transformation is conformal! (Or, to be precise, is when some special cases are excluded.) It is unfortunate that the plugin works only with paths made of straight line segments. It is my hope to remove that restriction some day.
I attach here the .xcf file in case somebody wants to do experiments with the plugin. I hope you will enjoy.
 linefigure_by_bezier.xcf (Size: 34.15 KB / Downloads: 492)
When you try the plugin, be sure to choose the right paths as the Line figure, the Base, the Target, and the Shaper. If you modify the Shaper, please try first with only tiny changes. The result will easily become very wild. The reason is that the plugin is based on a polynomial map of degree 3 (coming from the Shaper) on the complex plane, and it is unwieldy. You can easily make the image to overlap itself. To predict the results is in practice not possible(?), so one just has to experiment. But the plugin has the input "Strength of shaping", default value is 1, and lowering its value will help. In effect, setting it closer to 0 will flatten the Shaper.
You may experiment with different Bases. You may even use the Line figure itself as the Base. In that case the plugin will use the first two anchors of the first stroke, and in this picture it happens to be the top edge of the grid from the left to the right. (In this picture, setting at the same time Base to 'reversed' gives a nicer result.)
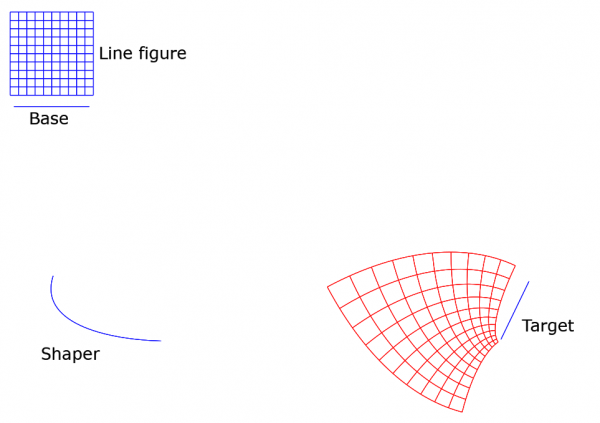
In the new version 0.6 I added two float arguments A and B to tweak the result. Default is A=0, B=1. Here is what happens when A=1, B=2, otherwise the inputs are as above:

Again, it is not possible to predict the outcome of different tweakings. Too complicated. The only way is to do experiments.
Sorry about the long post. You can safely skip the rest if mathematics is not in your line. I want to explain the mathematical idea behind the transformation. It is my own idea, but of course I am hardly the first one to get this simple idea. But I don't remember having seen it anywhere. When you have understood it once, you'll agree that it is rather obvious but nevertheless a nice idea.
I tried first to write the explanation in ASCII but abandoned soon the effort and just used LaTeX to make a small .pdf. It is attached here:
 transformation_by_bezier.pdf (Size: 84.62 KB / Downloads: 601)
When I first got the idea of this transformation (must be almost two years ago) and realized that it is conformal and sends straight lines to Bézier curves, I became really curious to see in a concrete way what the map would look like. That means making drawings on the screen. With this plugin I can do it now.
Some words about the new tweakings A and B: The way I first implemented the plugin, it had the following special property (and still has when A=0, B=1): If the Base happens to be a part of the Line figure, the image of the Base will be a similar copy of the Shaper. This may be a nice feature. It just dawned on me yesterday that if we dispense with that similarity condition, we have plenty of other transformations and much richer choice of equally nice figures, as I soon noticed by experimenting. In the new version 0.6 it goes like this (if I understand it right): With the tweaking inputs A and B, instead of the Shaper the plugin uses another arc of the same infinite Bézier curve (of which the Shaper is a segment), namely the arc between parameter values t=A and t=B. The image of the Base is then similar to that arc.
I continue talking of the plugins (see posts #1 and #2). Now the second plugin,
Transform a line figure by a Bezier arc
How to get it and how to invoke it, see the bottom of post #1. This plugin is supposed to be applied only to paths consisting of straight line segments; I call those "line figures". (You can apply it to any paths but only anchors are taken into account, so that the edges between anchors are treated as straight line segments.)
To use the plugin you have to provide four input paths:
1. The Line figure: the path to be transformed (by right-clicking in Gimp's Paths tab).
2. The Base: a path with two anchors.
3. The Target: a path with two anchors.
4. the Shaper: a path with two anchors.
Of the first three input paths only the anchors are taken into account; any curviness is ignored. The Shaper, on the contrary, is supposed to be a proper arching curve: it will determine the "shape" of the transformation, that is, how the transformation will curve line segments.
Just as for the affine maps, the anchors of the Base will be mapped to the anchors of the Target. The position of the Shaper has no effect, only the shape.
It is easiest to give a picture:
You see the four input paths (in blue). The Line figure is the small grid at top left. The transformation deformes the grid and puts it at a different location; the result is shown in red. Notice that right angles are preserved. This is no coincidence - the transformation is conformal! (Or, to be precise, is when some special cases are excluded.) It is unfortunate that the plugin works only with paths made of straight line segments. It is my hope to remove that restriction some day.
I attach here the .xcf file in case somebody wants to do experiments with the plugin. I hope you will enjoy.
 linefigure_by_bezier.xcf (Size: 34.15 KB / Downloads: 492)
When you try the plugin, be sure to choose the right paths as the Line figure, the Base, the Target, and the Shaper. If you modify the Shaper, please try first with only tiny changes. The result will easily become very wild. The reason is that the plugin is based on a polynomial map of degree 3 (coming from the Shaper) on the complex plane, and it is unwieldy. You can easily make the image to overlap itself. To predict the results is in practice not possible(?), so one just has to experiment. But the plugin has the input "Strength of shaping", default value is 1, and lowering its value will help. In effect, setting it closer to 0 will flatten the Shaper.
You may experiment with different Bases. You may even use the Line figure itself as the Base. In that case the plugin will use the first two anchors of the first stroke, and in this picture it happens to be the top edge of the grid from the left to the right. (In this picture, setting at the same time Base to 'reversed' gives a nicer result.)
In the new version 0.6 I added two float arguments A and B to tweak the result. Default is A=0, B=1. Here is what happens when A=1, B=2, otherwise the inputs are as above:
Again, it is not possible to predict the outcome of different tweakings. Too complicated. The only way is to do experiments.
Sorry about the long post. You can safely skip the rest if mathematics is not in your line. I want to explain the mathematical idea behind the transformation. It is my own idea, but of course I am hardly the first one to get this simple idea. But I don't remember having seen it anywhere. When you have understood it once, you'll agree that it is rather obvious but nevertheless a nice idea.
I tried first to write the explanation in ASCII but abandoned soon the effort and just used LaTeX to make a small .pdf. It is attached here:
 transformation_by_bezier.pdf (Size: 84.62 KB / Downloads: 601)
When I first got the idea of this transformation (must be almost two years ago) and realized that it is conformal and sends straight lines to Bézier curves, I became really curious to see in a concrete way what the map would look like. That means making drawings on the screen. With this plugin I can do it now.
Some words about the new tweakings A and B: The way I first implemented the plugin, it had the following special property (and still has when A=0, B=1): If the Base happens to be a part of the Line figure, the image of the Base will be a similar copy of the Shaper. This may be a nice feature. It just dawned on me yesterday that if we dispense with that similarity condition, we have plenty of other transformations and much richer choice of equally nice figures, as I soon noticed by experimenting. In the new version 0.6 it goes like this (if I understand it right): With the tweaking inputs A and B, instead of the Shaper the plugin uses another arc of the same infinite Bézier curve (of which the Shaper is a segment), namely the arc between parameter values t=A and t=B. The image of the Base is then similar to that arc.


